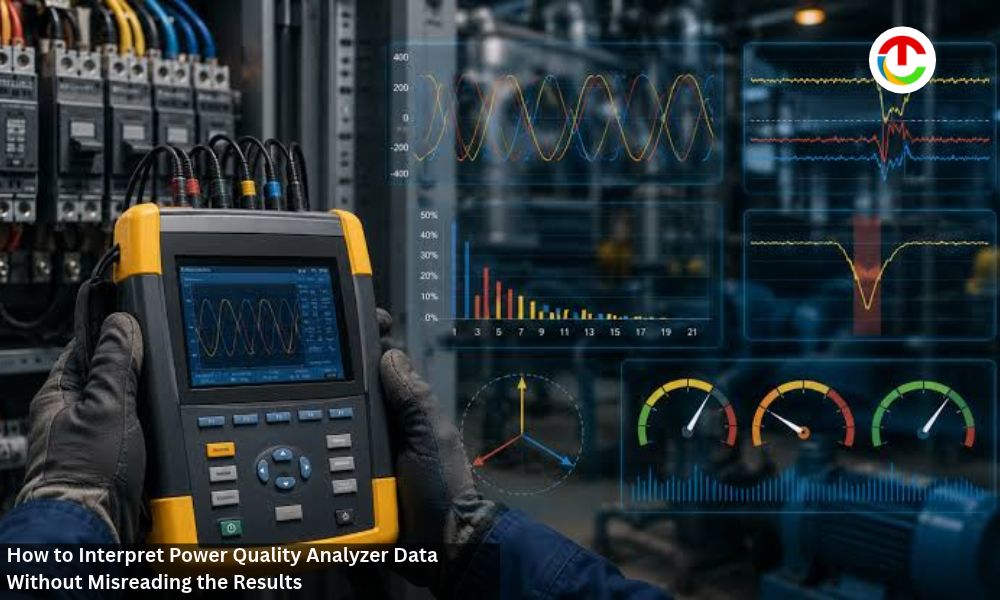
A plant engineer installs a logger on the main switchboard after a packaging line trips three times in one week. Seven days later, the download contains thousands of values, a long event list, and several alarming charts. Some of those entries explain the trips, others describe normal operation, and a few may reflect the setup itself.
Separating these groups is the core of power quality data analysis. This article explains how to frame the problem, check the recording, read events and harmonics in context, and turn the results into a conclusion that holds up.
Start With the Electrical Problem and Measurement Context
Data becomes meaningful once it is tied to a specific question and a verified connection. Both belong at the start of the analysis, ahead of any chart.
Define What Needs to Be Explained Before Collecting Data
A clear problem statement decides where the instrument goes, what it records, and for how long. Useful starting questions include:
What happened?
Equipment trips, flickering lights, overheating transformers, or high utility bills each point toward different measurements.
When did it happen?
Dates, shifts, and process steps help narrow the recording window.
Where is the affected equipment?
The monitoring point should sit as close to it as the problem allows.
Which loads are sensitive?
Drives, controllers, and computers react to disturbances that motors may ride through.
What does a good outcome look like?
A confirmed cause, a compliance check, or a baseline for future comparison requires different depth.
Answering these questions shapes the plan for power quality monitoring. A trip investigation may need fast event capture at the machine, while a utility dispute calls for long-term recording at the service entrance. The period should also span the full production cycle, including weekends or batch changes where they occur.
Writing down the working hypothesis before installation also helps. It guides the choice of thresholds that capture the suspected events without filling memory with minor ones.
Verify How Voltage and Current Were Recorded
A plot can look plausible and still describe the wrong circuit. Before interpreting any value, confirm the following:
1. Wiring configuration —
the selected mode, such as a three-phase four-wire wye or a three-wire delta, matches the actual system.
2. Phase identification —
each lead and sensor sits on the conductor its label names.
3 .Direction —
the arrow on each current clamp points toward the load, since a reversed sensor makes power on that phase appear negative.
4. Scaling —
probe and potential transformer ratios are entered correctly.
5. Rated inputs —
the analyzer, leads, and accessories carry voltage and measurement category ratings suitable for the location.
6. Recording settings —
nominal voltage, event thresholds, and averaging interval match the investigation’s purpose.
7. Clock —
the analyzer time agrees with site systems, since timestamps are later compared with operating logs.
Small mistakes are common: a clamp placed on the neutral, a lead clipped to the wrong bus bar, or a 1000:1 ratio entered as 100:1. Each one produces data with a normal shape and the wrong magnitude or phase.
A phasor display gives a quick check of the first three items, because the angles between voltages and currents reveal swapped or reversed connections. Photographs of the hookup and notes on panel labels make later verification easier.
Working on energized equipment exposes the installer to shock and arc-flash hazards. Appropriately qualified personnel should perform the task under the site’s electrical safety procedures, with suitable protective gear, and remove the leads with the same precautions.
Read Voltage and Current Events in Context
Once the recording is verified, events can be examined. Their meaning depends on how they relate to the long-term trend and to what the site was doing at the time.
Interpret RMS Trends Alongside Sags, Swells, and Interruptions
RMS voltage trends show the steady behavior of the supply over hours and days. Commonly used event definitions describe departures from that baseline:
- Sag — a short drop below about 90% of nominal.
- Swell — a brief rise above roughly 110%.
- Interruption — supply below approximately 10% of the rated value.
On a 480 V system, the 90% threshold corresponds to 432 V.
Voltage sags and swells gain meaning when read against the trend. A dip that starts from a level already near the lower limit tells a different story from one that begins at nominal.
The averaging interval affects what the trend shows. A 10-minute value smooths out a two-second dip, so minimum and maximum readings recorded within each period help reveal short disturbances. The event log then supplies duration, depth, and the phases involved.
A power quality analyzer usually collects both views at once. The AEMC PowerPad III 8333, for example, can record up to 29 variables as trends while its alarm mode logs threshold crossings, which lets the two be compared on one timeline.
Depth and duration work together. A brief sag to 80% may pass unnoticed by many loads, while the same reduction lasting several seconds can drop motor contactors or stop variable-speed drives. Repeated shallow dips can matter as well, because some control relays release at levels that bigger motors tolerate.
Relate Electrical Events to Loads and Site Activity
Power quality events point to a cause when they are matched with operating records. Three comparisons tend to be useful:
- Current behavior during the event — a sag accompanied by a sharp rise in amperes at the monitoring point often originates downstream, such as a sizable motor start. A dip without that increase usually comes from the supply side.
- Timing — events that repeat at shift changes, compressor cycles, or welding operations suggest an internal source.
- Phase pattern — a disturbance on one phase can point to a single-phase load or fault, while a balanced sag across three phases fits a three-phase cause.
Operator logs, maintenance records, and utility outage notices complete the picture. Drive trip codes and controller alarms with timestamps give exact moments to search for in the event list. For the packaging line, a sag that coincides with a chiller start and a current spike at the same instant would direct attention inside the plant.
A second recording point can strengthen the case. If the same disturbance appears at the service entrance with no matching load change, its origin probably lies beyond the plant boundary.
Interpret Harmonics and Power Measurements Carefully
Harmonic and power readings carry their own definitions, and those definitions shape the numbers on the screen. Understanding them prevents false alarms and missed problems.
Understand THD in Relation to Fundamental Values and Load
Harmonic distortion describes waveform content at multiples of the fundamental frequency, and total harmonic distortion (THD) expresses it as a single percentage. Two reference bases are common:
- Relative to the fundamental — the usual default, which can exceed 100% for heavily distorted current.
- Relative to the total RMS value — capped below 100% and lower than the first figure for the same waveform.
The selected basis has to be known before comparing readings from different instruments or reports. The harmonic order range matters as well: an analyzer that sums orders up to the 50th can report a different total from one that stops earlier.
Load level changes the interpretation of current THD. At reduced output, a small harmonic flow can produce a high percentage while carrying little heating effect. Some assessments therefore relate this content to the facility’s maximum demand load, a figure known as total demand distortion.
Production schedules matter too. A reading taken while drives run at partial speed can differ from one at full output, so a trend across a working day says more than a single snapshot.
Voltage and current THD answer separate questions. Current distortion shows what the loads draw, and voltage distortion shows how strongly that draw affects the supply shared with other equipment. Individual orders, such as the 5th and 7th typical of six-pulse drives, help identify the source.
Keep Power, Energy, and Power Factor Distinct
Several quantities describe electrical loading, and each answers a different question:
- Active power (W) — the rate at which energy is converted into work or heat.
- Reactive power (var) — the exchange between source and load in magnetic and electric fields.
- Apparent power (VA) — the product of RMS voltage and current, which sets the loading of cables and transformers.
- Energy (kWh) — active power accumulated over time, which is what utility meters bill.
Power factor compares watts with volt-amperes. A feeder drawing 100 kW at 125 kVA, for example, has a ratio of 0.8, and its 75 kvar of reactive power raises current without adding useful work.
Two variants appear on many screens. Displacement power factor considers the fundamental frequency, while true power factor includes harmonic effects, so the two diverge on distorted systems. Instruments also differ in how they sign leading and lagging values.
Three-phase Power Quality Analyzer measurement adds further detail. With unbalanced loads, analyzers may calculate total volt-amperes by different methods, which leads to different totals for the same circuit. The wiring configuration also affects which per-phase values carry physical meaning: on a three-wire delta connection, individual line figures may lack it even when the sum is correct.
Energy totals depend on the recording period as well. A week that includes a shutdown will understate typical consumption.
Checking the instrument’s definitions and the selected configuration comes before comparing its readings with a utility meter or another analyzer.
Turn Recorded Power Quality Analyzer Measurements Into an Evidence-Based Conclusion
Verified data and a clear grasp of each quantity prepare the ground for a conclusion. The remaining steps compare results with suitable criteria and document them so others can follow the reasoning.
Compare Patterns With the Relevant Criteria and Operating Conditions
A reading becomes significant once it is set against a reference that fits the question. Possible references include:
- Supply limits — permitted voltage range and distortion levels agreed with the utility or set by applicable regulations.
- Equipment tolerance — manufacturer ride-through data and published voltage tolerance curves for sensitive equipment.
- Site specifications — internal limits for harmonic emissions, power factor, or unbalance.
- Baseline data — earlier recordings from the same point under similar production levels.
Some criteria express limits as a share of measurement intervals over a week. Under such rules, a short exceedance may remain acceptable while a sustained one breaches the limit.
Operating conditions decide which comparison is fair. Harmonic levels recorded during a holiday shutdown represent a different state from those measured at full production. A power factor reading taken with capacitor banks switched off describes a temporary configuration.
Voltage unbalance between phases deserves its own comparison, since it adds heating in three-phase motors.
Conclusions gain weight when a pattern repeats across several events or days and matches load or process records.
Power Quality Analyzer Report Settings, Time Context, and Next Steps
A compact report lets another engineer verify the findings or reproduce the measurement. It should include:
- Location — the panel, feeder, or equipment and its position in the distribution system.
- Wiring configuration — the selected mode and nominal voltage.
- Sensors and settings — clamp types, ranges, scaling, thresholds, and averaging interval.
- Monitoring period — start and end times, plus any gaps in recording.
- Events — counts, depths, durations, and affected phases, with their likely causes.
- Trends — voltage, current, harmonics, and power factor over the period, with notable changes.
- Instrument details — model, serial number, and firmware version.
- Limitations — conditions outside the recorded data, such as an untested production mode or a single monitoring point.
Representative waveform captures and trend charts let readers see the evidence behind each statement. Wording that separates a probable cause from a confirmed one keeps the conclusion proportionate to the data.
The Power Quality Analyzer report closes with proposed next steps. These might include monitoring at another point, a longer recording period, a mitigation trial, or a discussion with the utility. Sharing the draft with operations staff before it is finalized often surfaces process events that help explain patterns in the data.
Power Quality Analyzer Building a Defensible Power Quality Conclusion
Power Quality Analyzer Interpretation begins with the problem that prompted the recording and a check that the connection, scaling, and settings match the circuit. With that foundation, voltage events are read against RMS trends and matched with load activity to separate supply-side causes from internal ones.
Harmonic values depend on their reference basis, order range, and load level, and power readings depend on definitions and wiring configuration. Comparing results with suitable criteria under representative operating conditions turns isolated numbers into evidence. A report that records the setup, time context, findings, and limitations allows the conclusion to be checked and the next step to be planned.
Also Read :- Data Center Electrical Power Distribution BIM and the Race to Build AI Capacity